
Google Analytics is a fantastic tool for seeing real-time how users are engaging with your website.
It's also a dense, overwhelming web of information.
With all that raw data at your fingertips, it's hard to know what's most important to keep track of. If you're digging into Google Analytics, you don't need to pay attention to every single number you see (unless you want to spend hours in analysis paralysis).
Instead, focus on the 10 most important website metrics.
Website Traffic Metrics
1. Total website traffic
A high-level metric that shows your overall site health and SEO strength is your total website traffic. This is how many users during a set period of time are visiting your site.
Tracking this on a month to month basis and during specific peak business events will show trends of how many users come to your site, as well as when they visit.
A yearly comparison is also helpful to measure growth over time and track seasonal trends annually.
2. Most viewed pages
The most viewed pages on your site can be a really useful metric to dig into. Where are people spending time on your site? And is it where you expect?
If you find users viewing a specific page or blog, you can use that information to go back and beef the page up even more. Is there currently an offer on the page? And if so, are people engaging with it or scrolling past?
→Read Now: How to Do a Digital Marketing Content Audit [Free Template]
3. Traffic source/medium
This metric shows where your website users are coming from. It also gives you a snapshot of how well your organic search traffic is working.
Ideally, organic Google traffic should be the biggest percentage of traffic if you're doing any SEO work at all and regularly posting blogs. If you are and it isn't your biggest percentage, that can give you a starting point for revisiting your content.
Beyond that, this metric will also show you other places your users are coming from. Direct traffic is the least valuable (but still important) as it represents people who directly typed in your URL. You'll also be able to see other sources and gauge your digital marketing efforts - like ads, social media, and email.
4. Keyword rankings
Keyword building is a slow process, but extremely important so that users can find you when they search for those keywords and keyphrases. Measure your keyword rankings a couple times a month and look for increases, big jumps or lags.
You can also use tools like SEMrush to compare your rankings to your competitors. These tools will also show you what keywords you're currently ranking for vs what keywords are most relevant to target.
→Read Now: How to do Keyword Research (And Why It Matters)
Accessibility and Engagement Metrics
5. Page load speed
If your pages load slowly your users will bolt and likely not return to your site again.
Ideally, your website should load in under 2 seconds. As load speed increases, the chances of your audience leaving rises as well.
There are a couple of simple fixes you can make to speed up your site:
- Removing redundant/useless text from your code (commas, spaces, unused code, code comments, etc.)
- Resizing and optimizing your images
- Enabling site compression
- Reducing the number of redirects
6. Pages per session
This metric shows you the average number of pages users visit per session.
This is a good indicator of engagement because it shows you if your visitors found many pages interesting and easy to navigate. Like your top pages, it also gives you insight as to where people are spending their time on your site.
7. Average session duration
This metric is exactly what it sounds like - it shows you the average length of each session. Session duration is another good barometer of engagement. Generally speaking, the longer users are on your site the more likely they will convert.
Now, this is a metric that doesn't tell you much on it's own because it's so broad. It's a good idea to look at this number in context with the rest of the metrics to draw more concrete conclusions. For example, you might have an extremely low session duration and a high pages per session - this could mean that users aren't finding what they're looking for and are bouncing around your site.
8. Bounce rate (maybe)
Bounce rate is the percentage of visitors to a who navigate away (bounce out) from your site after only viewing one page. What a "good" bounce rate looks like will vary based on the page type and goal. Generally speaking, a site-wide bounce rate should be 61.04% for a B2B site, 54.24% for a B2C site and 52.36% for a hybrid site (source).
Like average session duration, bounce rate doesn't really tell you much on it's own. A high bounce rate might LOOK bad at first glance, but digging deeper into the whole picture of your site might show that you're still getting good traffic and engagement.
Bounce rate is a metric that's been hotly debated in 2021, and will certainly still be in 2022. In fact, Google's new analytics update removes bounce rate altogether. For now, it's a good idea to keep tracking it alongside other metrics - just don't take it alone.
→Read Now: Is Bounce Rate Relevant to SEO in 2021?
Conversion Metrics
9. Click-through rate (CTR)
The click-through rate is calculated by clicks divided by impressions. In Google Analytics, this can be used to gauge how well your keywords and ads are performing. It also gives you some high-level data on your content.
If your click-through rate is much lower than industry averages, it could mean that the content in your ads or on your pages isn't compelling or clear enough for people to want to click.
10. Conversion rate
Conversion rate is the number of people who complete a desired action (such as filling out a form) out of your total number of website visitors. This is one step further beyond click through rate.
Track your conversion rate in Google Analytics, across the ads you are currently running and through the forms filled out on your site. You'll want to measure conversions based on your marketing goals.
Conversion by source is another metric that's related to conversion rate. This shows you where people came from before they converted. This is extremely useful to know to measure your marketing efforts and what your best performer currently is - are people coming into a blog and then converting, are they coming from an ad, from social media, or somewhere else?
Final Thoughts on Metrics
The bottom line is that your page has to load fast, the links have to work (no 404s), and the architecture has to be sound. Your content has to address queries before the user has to ask to keep them on the page longer. Tools like Google Analytics and SEMrush pull data together so you can track, analyze, and correct any errors.
None of these metrics should be taken on their own. But looking at all 10 together help paint a picture of how your site is doing. Instead of focusing on every single number in Google Analytics, make these your priority.
Most users won’t return to a site that doesn’t perform well, or if they have had a bad experience, so make the most of your site: Establish, optimize, and then expand your website. Growth Driven Design (GDD) is an approach that incorporates monthly analysis into continuous improvement to keep your website fresh and engaging for your users.
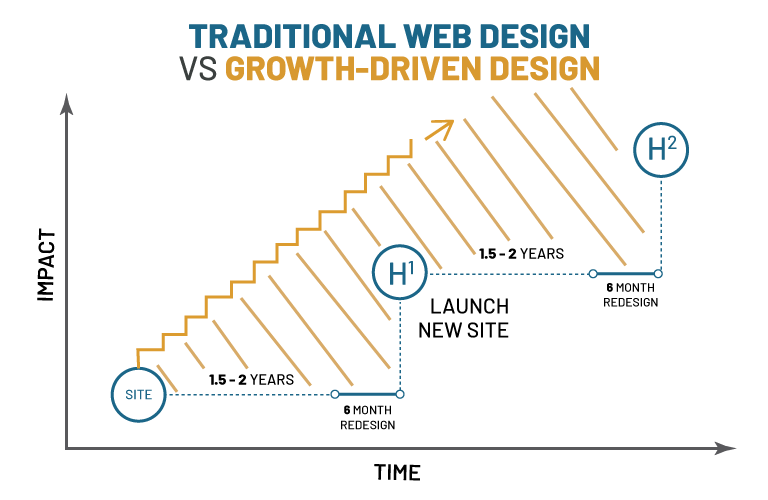
Improving Your Site's Performance With Growth-Driven Design
Traditional web design is broken. The struggle with traditional design is that almost immediately after a site is launched, the design and content begins to grow stale. The internet is an ever-evolving beast, and when your site doesn’t evolve along with it, it ages quickly. Many business owners are trapped in this cycle:
Spend 6-8 months redesigning a new website —> It looks good —> Don’t redesign for 3-5 years —> It starts looking bad —> Redesign site again —> Repeat
That’s where Growth-Driven Web Design (GDD) steps in. With GDD, websites are continuously updated every month, with substantive changes to keep your users engaged and moving through the buyer’s journey.
Growth-Driven Web Design breaks out of the mold of traditional design to take a more proactive approach. It focuses on converting leads and staying on top of design trends. This way, you can catch and resolve any problems immediately, before they start negatively impacting your website.
* * *
Get Better Results with Growth-Driven Web Design - Free eBook
Growth-Driven Web Design is not only easier on your team and wallet- continuous updates and improvements to your website will keep your customers coming back for more. This free eBook goes over Growth-Driven Web Design and what you need to know to get started.

BizzyWeb is a Minneapolis-based digital marketing and web design agency that helps companies get the high-quality leads they need to grow and thrive. Our tactics include inbound marketing, SEO, advertising, web design, content creation and sales automation. We are an accredited HubSpot Platinum Partner and we offer full-service HubSpot onboarding, enablement and strategy for new and current users.